
This report will show totals per group for each team. This report will help you to see how teams are performing.
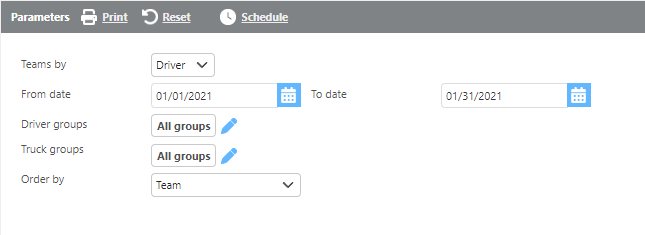
Report Parameters
Info
At least one group will need to be selected to provide data.
|
Field |
Description |
|
Teams by |
Select if this report should be run by Driver or Truck. |
|
From/To date |
Enter a date range to run the report. |
|
Driver groups |
Select a specific driver group here. |
|
Truck groups |
Select a specific truck group here. |
|
Order by |
Select from the drop-down how this report should be ordered. |
Report Columns
|
Field |
Description |
|
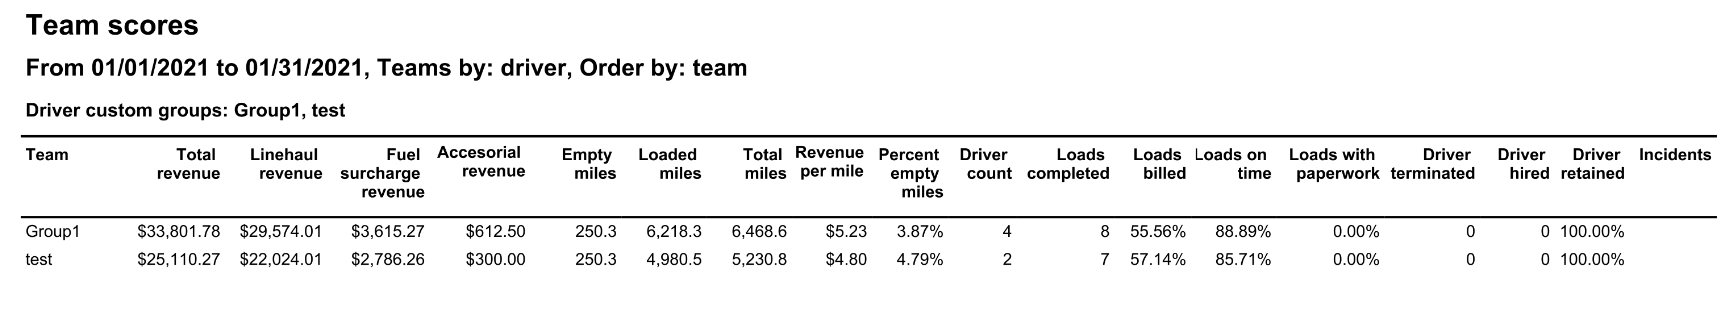
Team |
The group name. |
|
Total revenue |
Data for total revenue. |
|
Linehaul revenue |
Data for linehaul revenue. |
|
Fuel surcharge revenue |
Data for fuel surcharge revenue. |
|
Accessorial revenue |
Data for accessorial revenue. |
|
Empty miles |
The total empty miles. |
|
Loaded miles |
The total loaded miles. |
|
Total miles |
The total miles. |
|
Revenue per mile |
The total revenue per mile. |
|
Percent empty miles |
The percent of miles that are empty. |
|
Driver count |
This field will show how many drivers belong to the group. |
|
Loads completed |
This field will show how many loads the team has completed. |
|
Loads billed |
The percentage of loads that have been billed. |
|
Loads on time |
The percentage of loads that have been on time. |
|
Loads with paperwork |
The percentage of loads that have paperwork on file. |
|
Driver termination |
The number of drivers that have been terminated in the date range. |
|
Driver hired |
The number of drivers that have been hired in the date range. |
|
Driver retained |
This field will show what percentage of hired drivers have stayed on for the date range. |
|
Incidents |
The number of incidents added for the team. |