
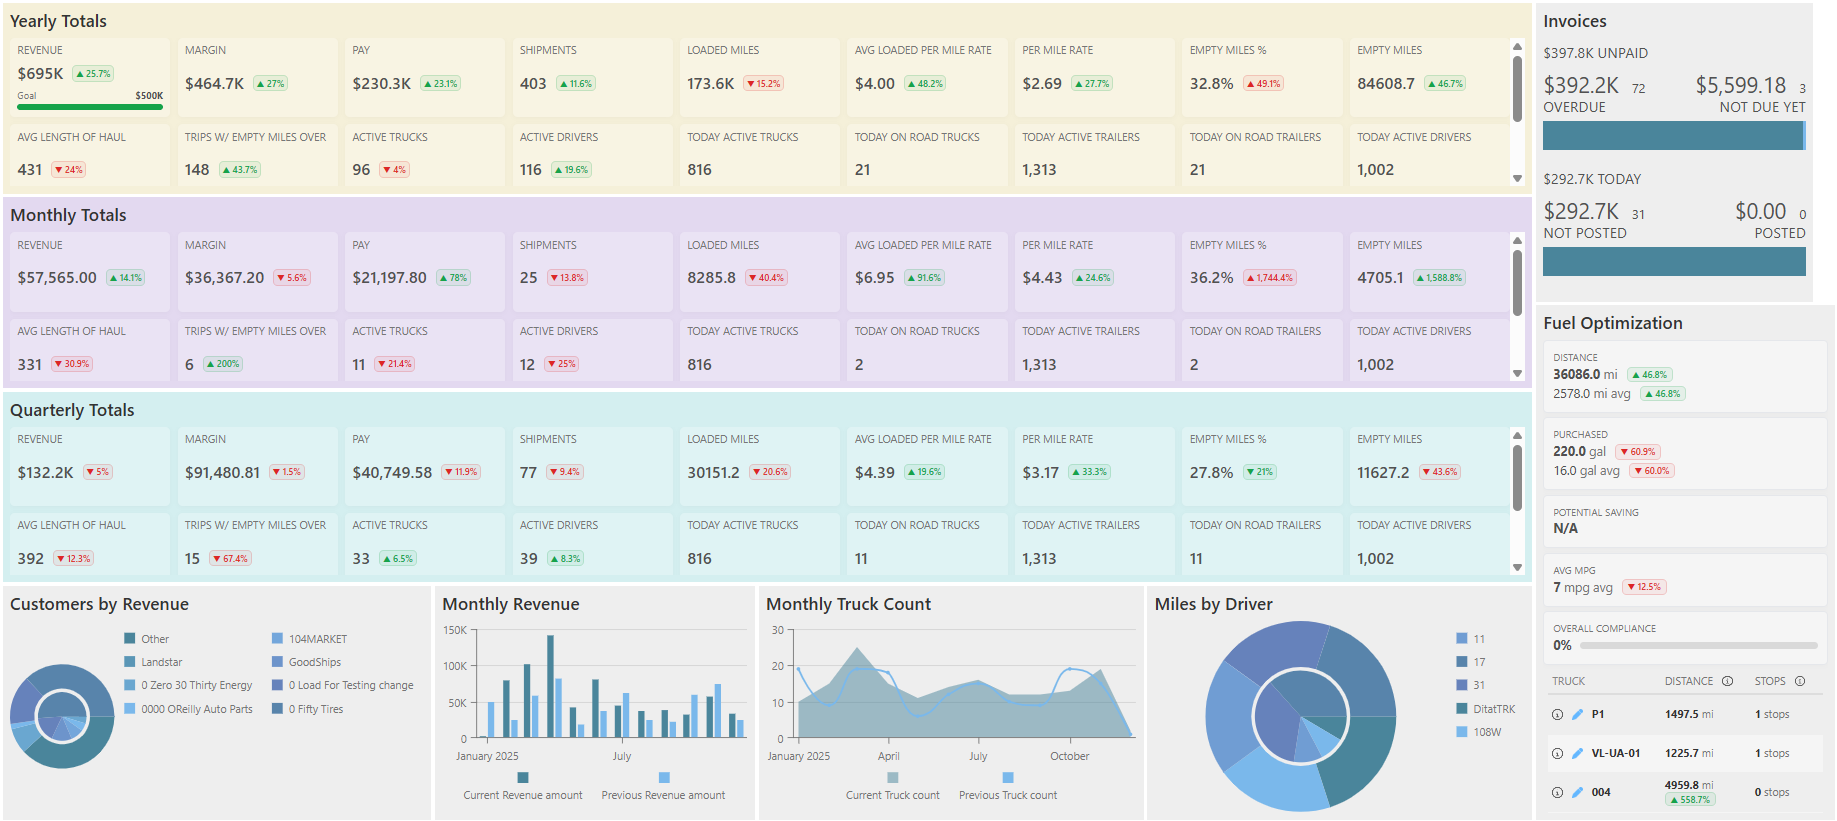
The Dashboard provides an overview of your company's performance through an interactive display of widgets that deliver quick insights and real-time updates about your organization.
Note: The Dashboard is designed to display general trends rather than real-time updates. Data is extensively cached to optimize performance and may be delayed by up to 24 hours depending on the widget. Recent changes may not be reflected immediately.
Click here for information on configuring the dashboard, adding tabs, and changing widgets.
Widget Controls
Every widget displays three icons in the top-right corner:
-
Clock — Hover over this icon to see when the widget's data was last loaded and when it will next update.
-
Info Bubble — Displays details about what data is included in the widget.
-
Pencil — Opens the widget's parameters so you can view or edit the configuration.
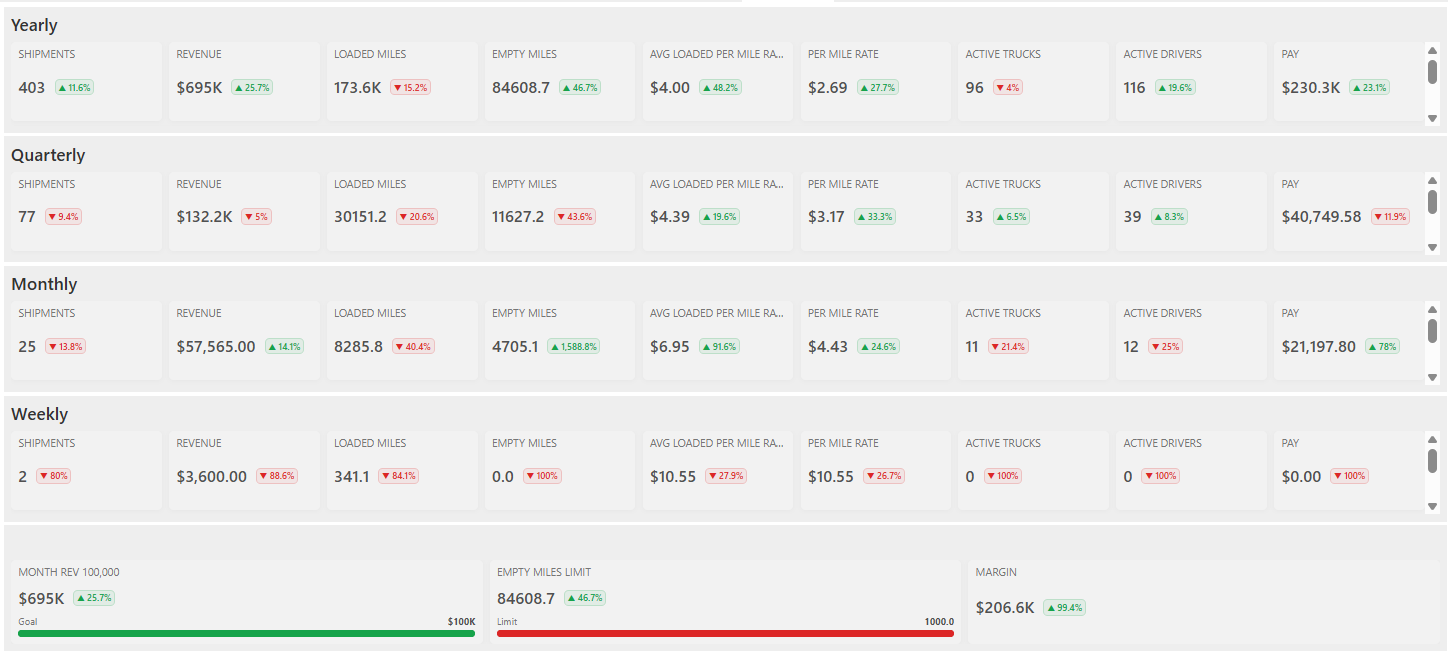
Totals Widgets
The Totals widget calculates data based on the number of days in the selected time frame.
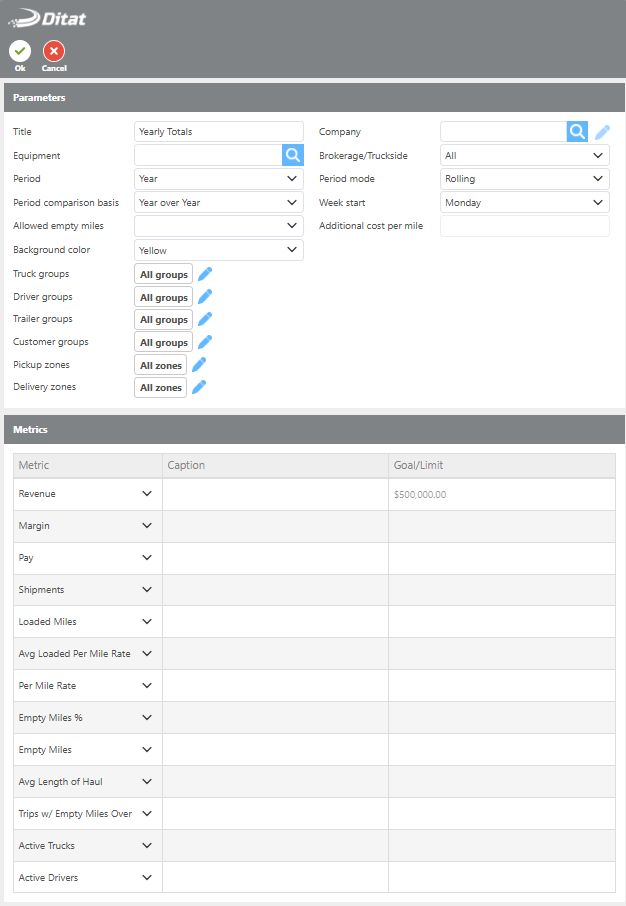
Period Mode allows you to choose between:
-
Rolling Period — Last 7 days for a week, last 30 days for a month, last 365 days for a year.
-
Whole Period — This week up to today, this month up to today, this year up to today.
Additional behavior:
-
Cancelled shipments are excluded from widget data.
-
The widget prioritizes actual times from check calls. If those are not available, appointment times are used.
-
If a load was scheduled to deliver last week but actually delivered this week, it will appear in this week's totals.
-
Loads scheduled to deliver this week will appear even if they have not yet been completed.
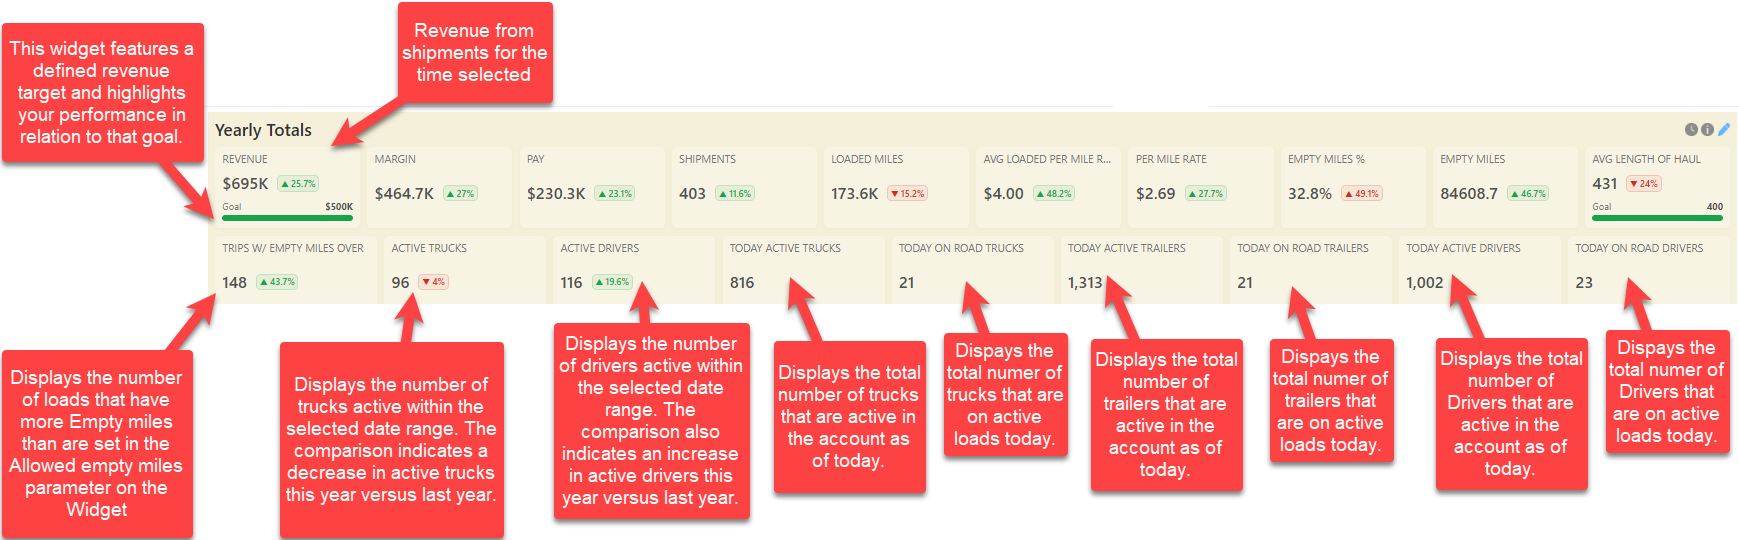
Totals Widget Details
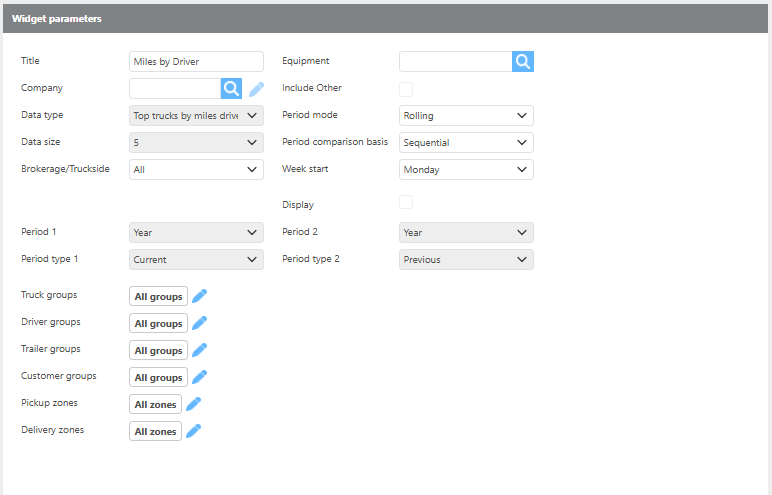
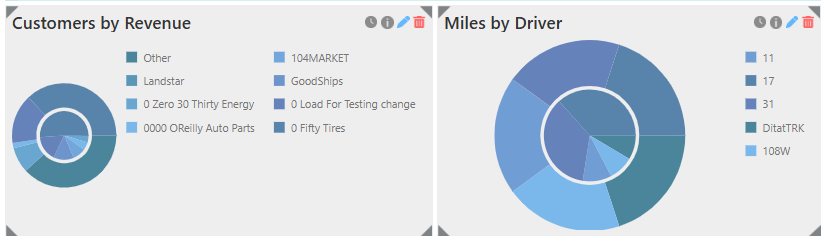
Pie Charts
-
Totals are calculated based on the date block selected — Week, Month, Quarter, or Year. For example, if set to Month, only loads delivering within that month are included.
-
Display defined data types for a selected period or compare to the previous period.
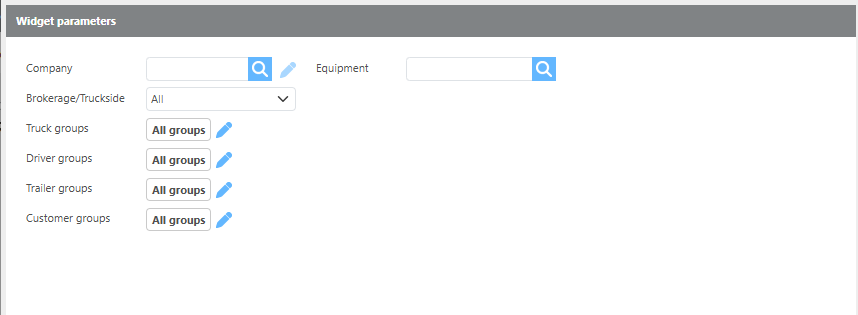
-
Can be configured for specific companies, equipment types, segments, or custom groups.
-
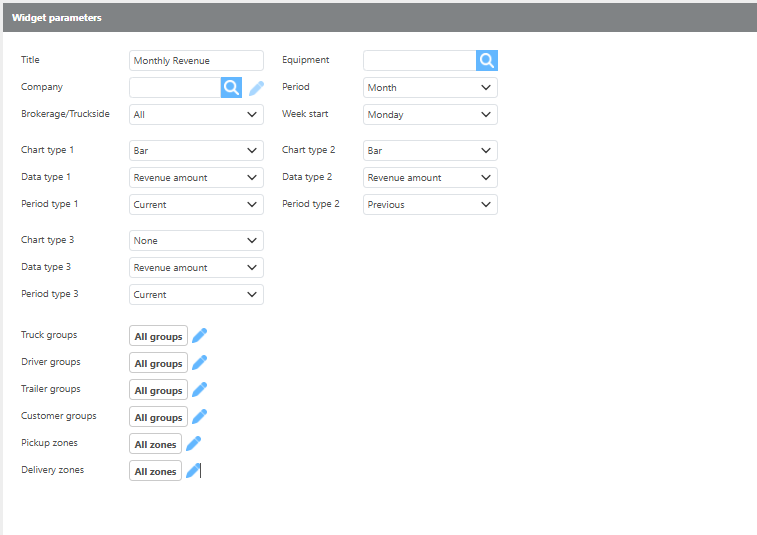
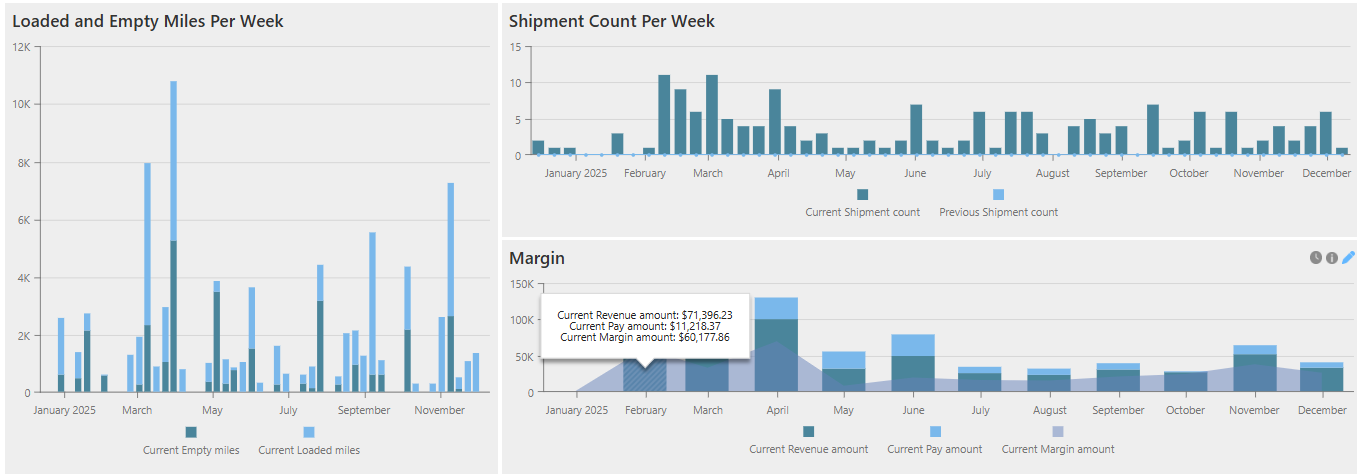
Graphs
Totals are calculated based on the date block selected — Week, Month, Quarter, or Year. For example, if set to Month, only loads delivering within that month are included
-
Display up to 3 sets of defined data across periods.
-
Can be configured for specific companies, equipment types, segments, or custom groups
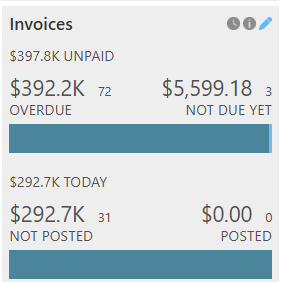
Invoices
-
Totals are calculated for the past 3 months.
-
Can be configured for specific companies, equipment types, segments, or custom groups.
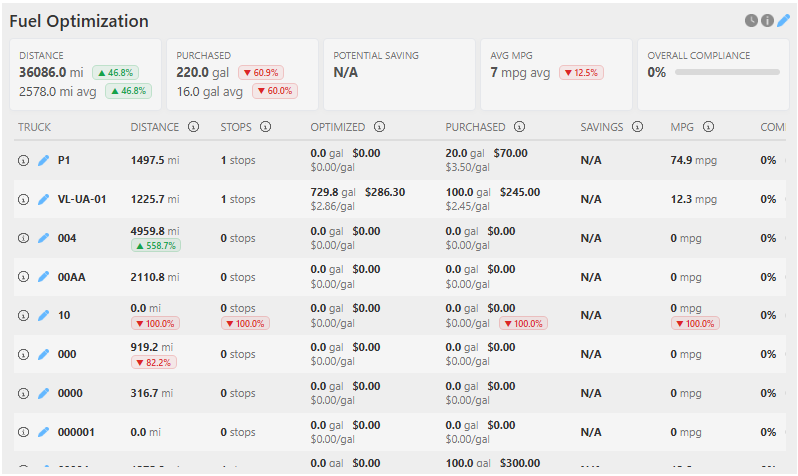
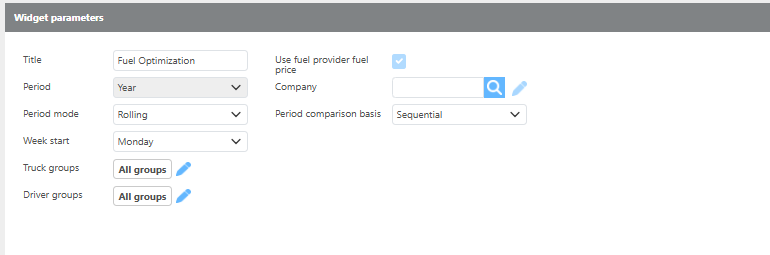
Fuel Optimization
Totals are calculated based on the date block selected — Week, Month, Quarter, or Year.
For example, if set to Month, the widget includes loads delivering within that month only (e.g., only loads delivering in March)
Will only show loads that have been completed or paid.
Totals are calculated based on the date block selected — Week, Month, Quarter, or Year. For example, if set to Month, only loads delivering within that month are included. Only completed or paid loads are included in this widget.
Note: The Use Fuel Provider Fuel Price checkbox should only be selected if you are uploading your own fuel prices for optimization. If this box is unchecked, retail prices will be used in calculations.
|
Field |
Description |
|---|---|
|
Distance |
Total miles driven, averaged per truck. |
|
Purchase |
Total gallons purchased, averaged per truck. |
|
Potential Savings |
Total potential savings across all trucks. |
|
AVG MPG |
Average MPG across all trucks listed. |
|
Overall Compliance |
Overall compliance rate for all trucks utilizing fuel recommendations. |
|
Truck |
The truck ID utilizing fuel optimization. |
|
Distance |
Total miles for the truck during the period. Uses ELD miles if available for current and previous periods; otherwise, uses TMS miles. |
|
Stops |
Total count of fuel stops in the period, based on advance data in the TMS. |
|
Optimized |
Total gallons suggested by the optimization feature, along with total price and average price per gallon. |
|
Purchased |
Total gallons purchased, total amount spent, and average price per gallon, based on advance data. |
|
Savings |
Total potential savings, calculated as: Total Amount Spent − (Total Gallons Purchased × Average Optimized Price Per Gallon). N/A results are common when using retail fuel prices or when imported advances have discounts split to a separate line. |
|
MPG |
Calculated based on miles driven and actual gallons purchased. |
|
Compliance |
Percentage of fuel stops on imported advances that match the fuel stops suggested by optimization. |
|
|
Clicking the detail icon opens the truck history for the selected period. Suggested fuel stops are displayed on the left; actual fuel stops from advances in the TMS are displayed on the right. 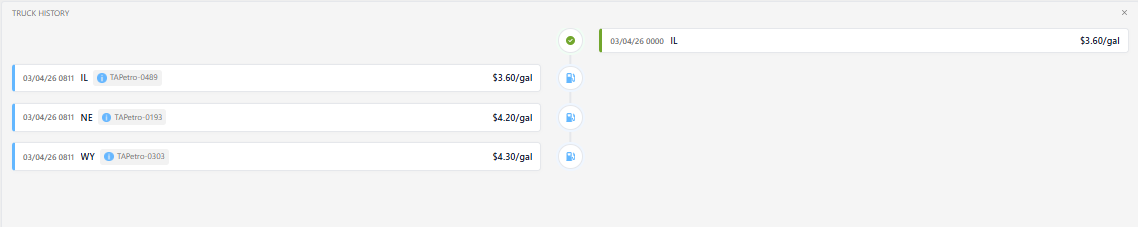
|
Note: This widget includes information bubbles on individual data points that display details about how and where the data is sourced when hovered over.