This report displays how often a specific location was used per month, along with the top 10 customers that have used the location most frequently.
|
Field |
Description |
|---|---|
|
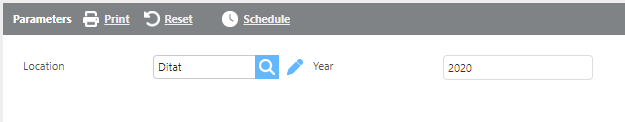
Location |
Select the location to run the report for. |
|
Year |
Select a year to compare against the current year. |
Report Columns
|
Field |
Description |
|
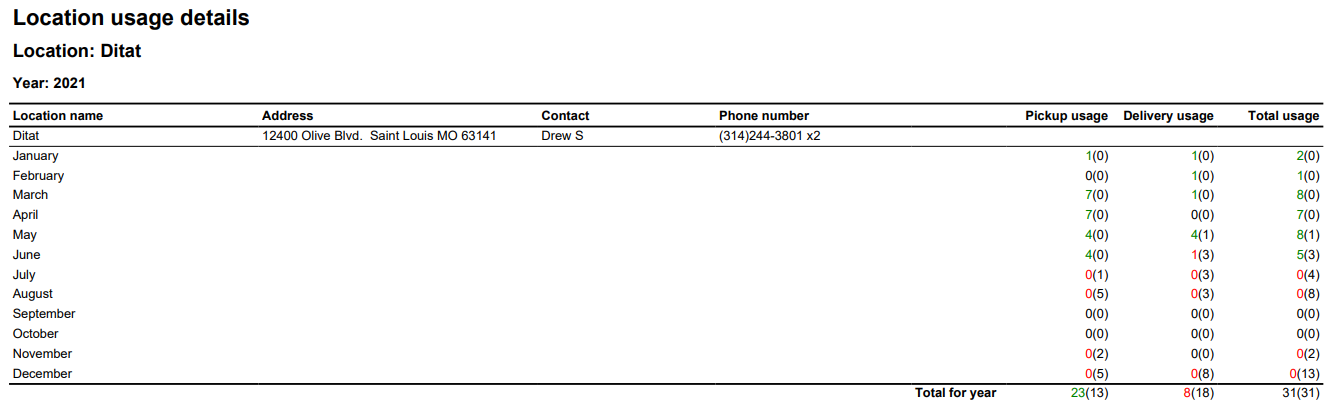
Location name |
The location ID. |
|
Address |
The location's address. |
|
Contact |
The location's contact name. |
|
Phone number |
The location's phone number. |
|
Pickup usage |
The number of pickups for the current year, with the comparison year's count in parentheses. |
|
Delivery usage |
The number of deliveries for the current year, with the comparison year's count in parentheses. |
|
Total usage |
The total location usage for the current year, with the comparison year's count in parentheses. |
-
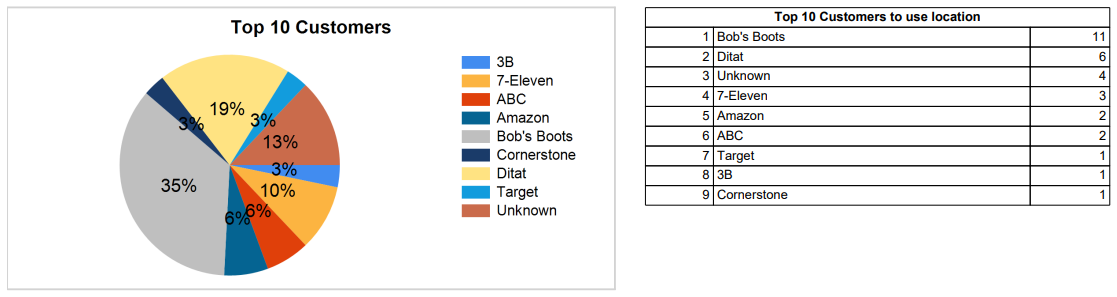
Pie Chart — Displays the percentage of total usage attributable to each customer at this location.
-
Graph — Displays the number of times each of the top 10 most frequent customers has used the location.