
Navigation: Rate & Pay → Lane Analysis
The Lane Analysis screen is a tool for brokered loads that helps identify carriers who have run a specific lane in the past 6 months, along with recent market rate data for that lane. The screen is organized into three main sections: Lane, 14-Day All-In Rate, and Carrier History.
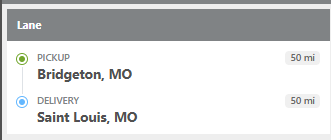
Lane
Displays the pickup and delivery city/state from the load. Results include loads that pick up and deliver within 50 miles of those locations.
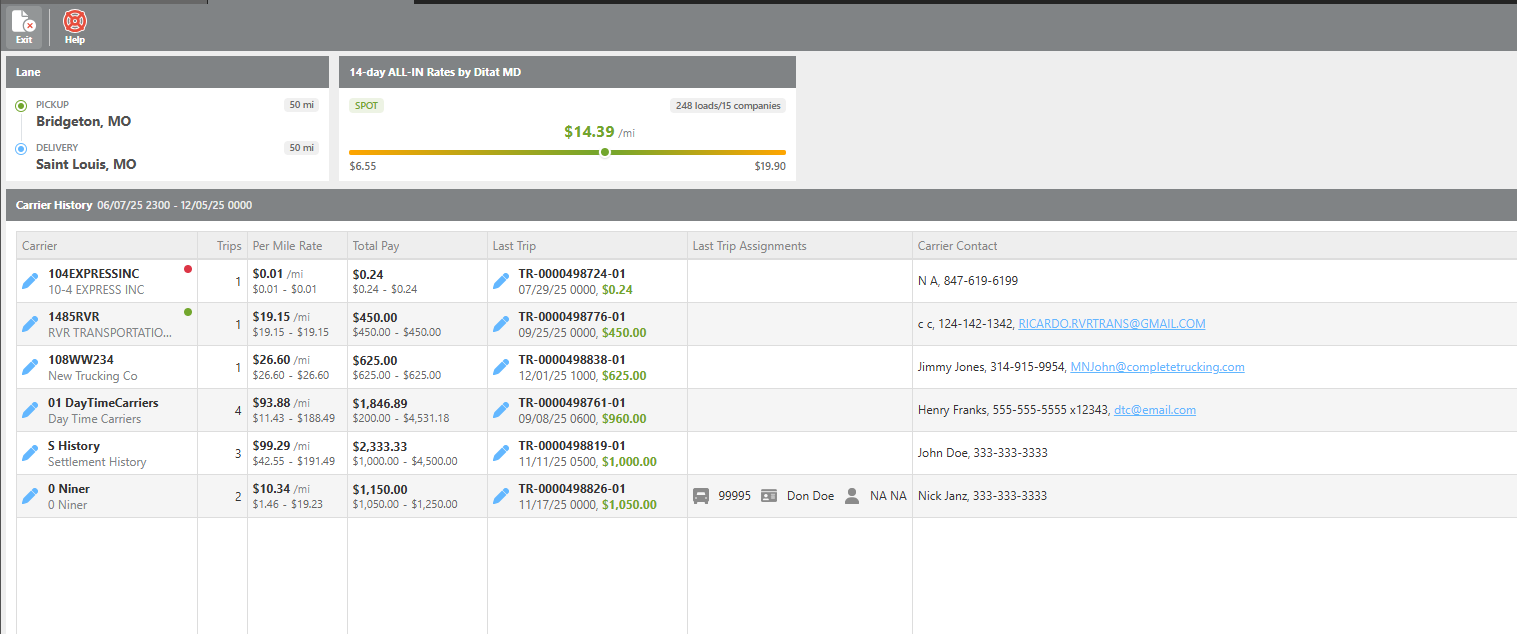
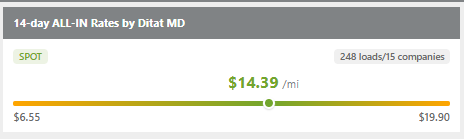
14 Day All-in rate
Provides rate insights for the selected lane based on master data across all companies for the past 14 days.
|
Information |
Description |
|---|---|
|
Rate Type Breakdown |
Indicates whether recent activity on this lane is primarily spot market or contract rates. |
|
Activity Summary |
Shows the total number of loads moved on this lane and how many companies hauled them within the last 14 days. |
|
Rate Statistics |
Displays the lowest, highest, and mean (average) rates recorded for this lane. |
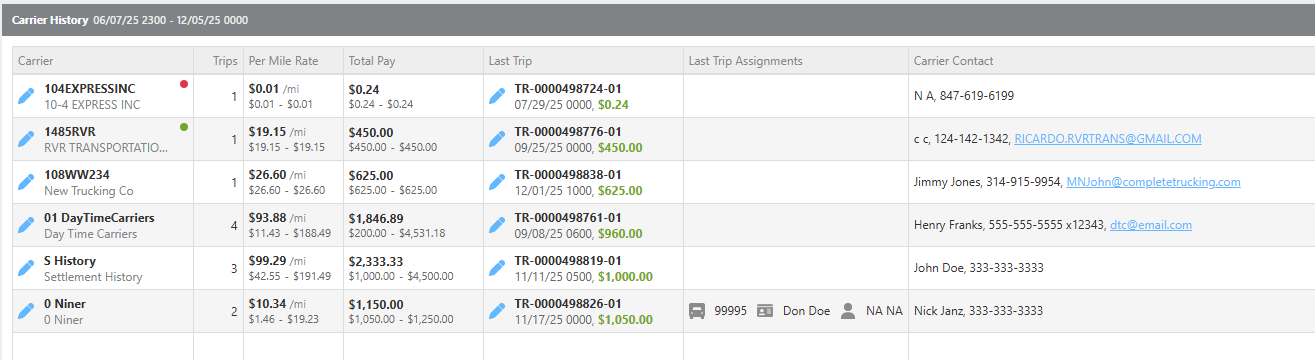
Carrier History
|
Column |
Description |
|---|---|
|
Carrier ID / Name |
The carrier's ID and company name. |
|
SaferWatch Score |
If integrated with SaferWatch, a score indicator will appear. A red indicator means the carrier's score is unsatisfactory. A green indicator means the score is satisfactory. |
|
Trips |
The number of trips this carrier has completed on this lane. |
|
Per Mile |
The highest, lowest, and mean rate per mile for this carrier's loads on this lane. |
|
Last Trip |
The most recent trip details, including the last trip assignment and carrier contact information. |